Are you keeping tabs on the number of return shipments your company is processing on an annual basis? Paying close attention to trends and spikes in returns can help you make informed product and personnel decisions.
Watch the video above or follow these steps to help your organization better understand your reverse logistics operations.
How to Create a Total Return Shipments Report for the Current Year
Launch Service Cloud
Click on the Reports tab in the navigation bar.
Then click New Report.
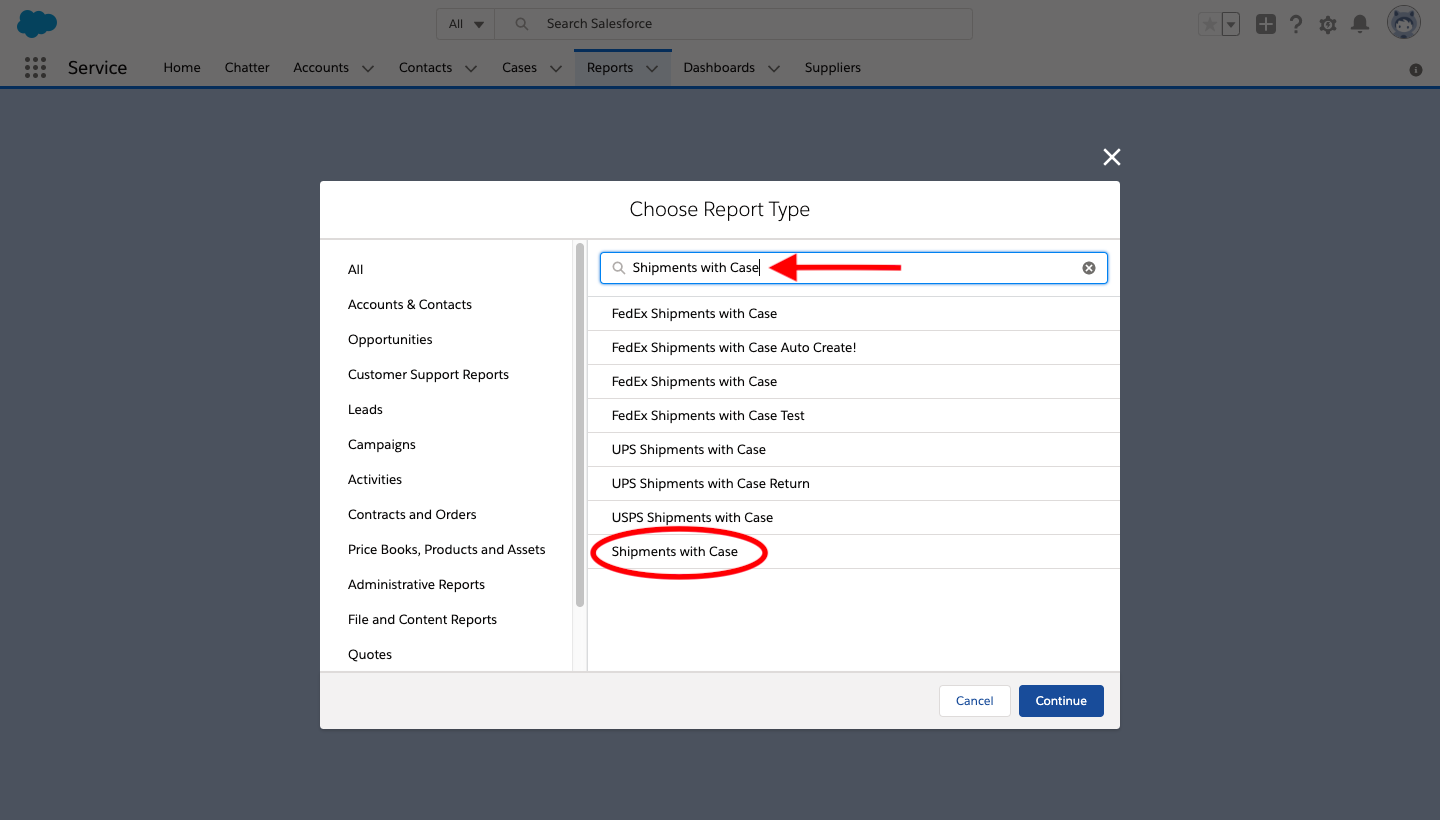
Choose Shipments with Case as your report type and click continue.
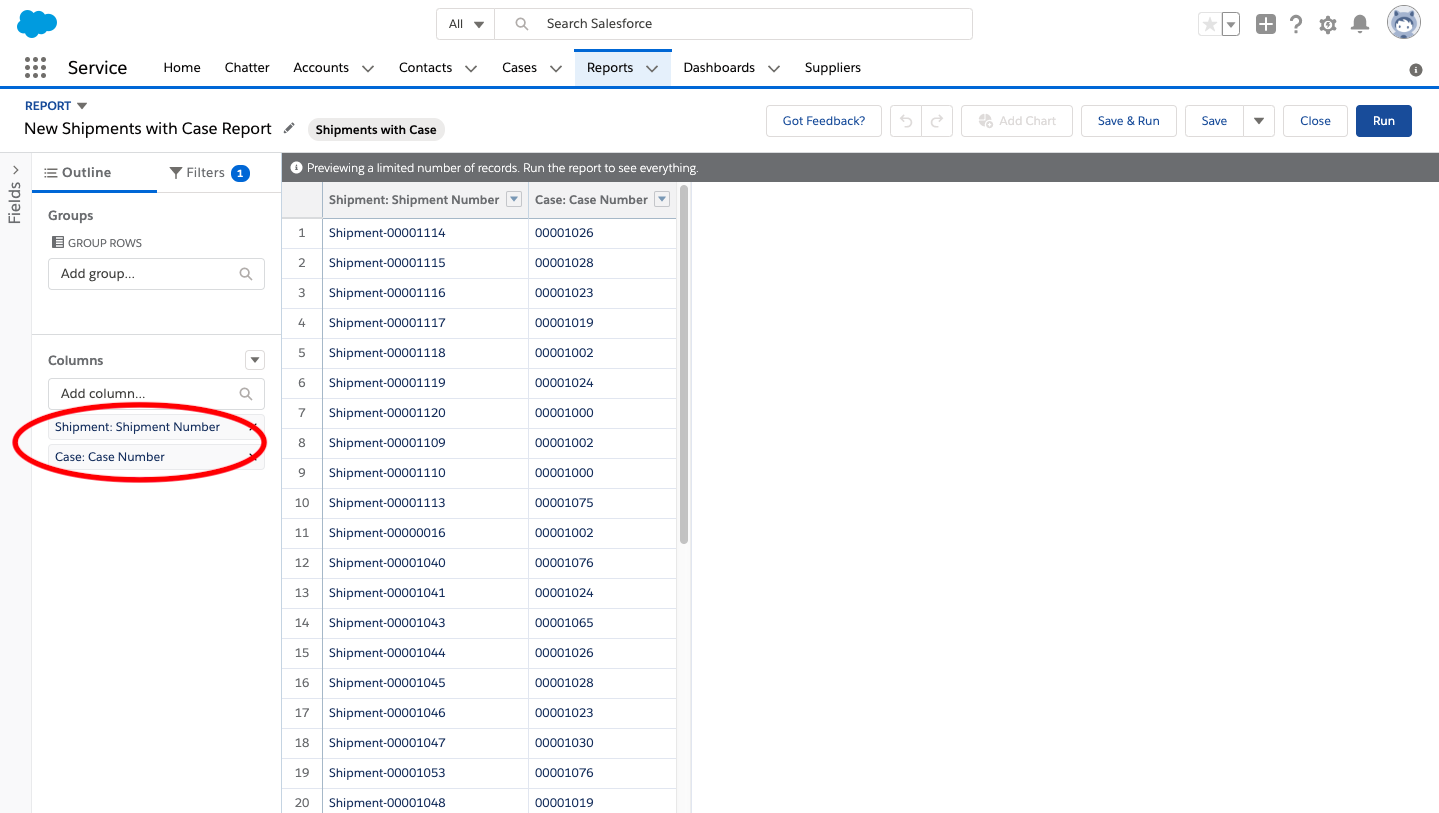
Add 2 columns: Case: Case Number & Shipment: Shipment Number
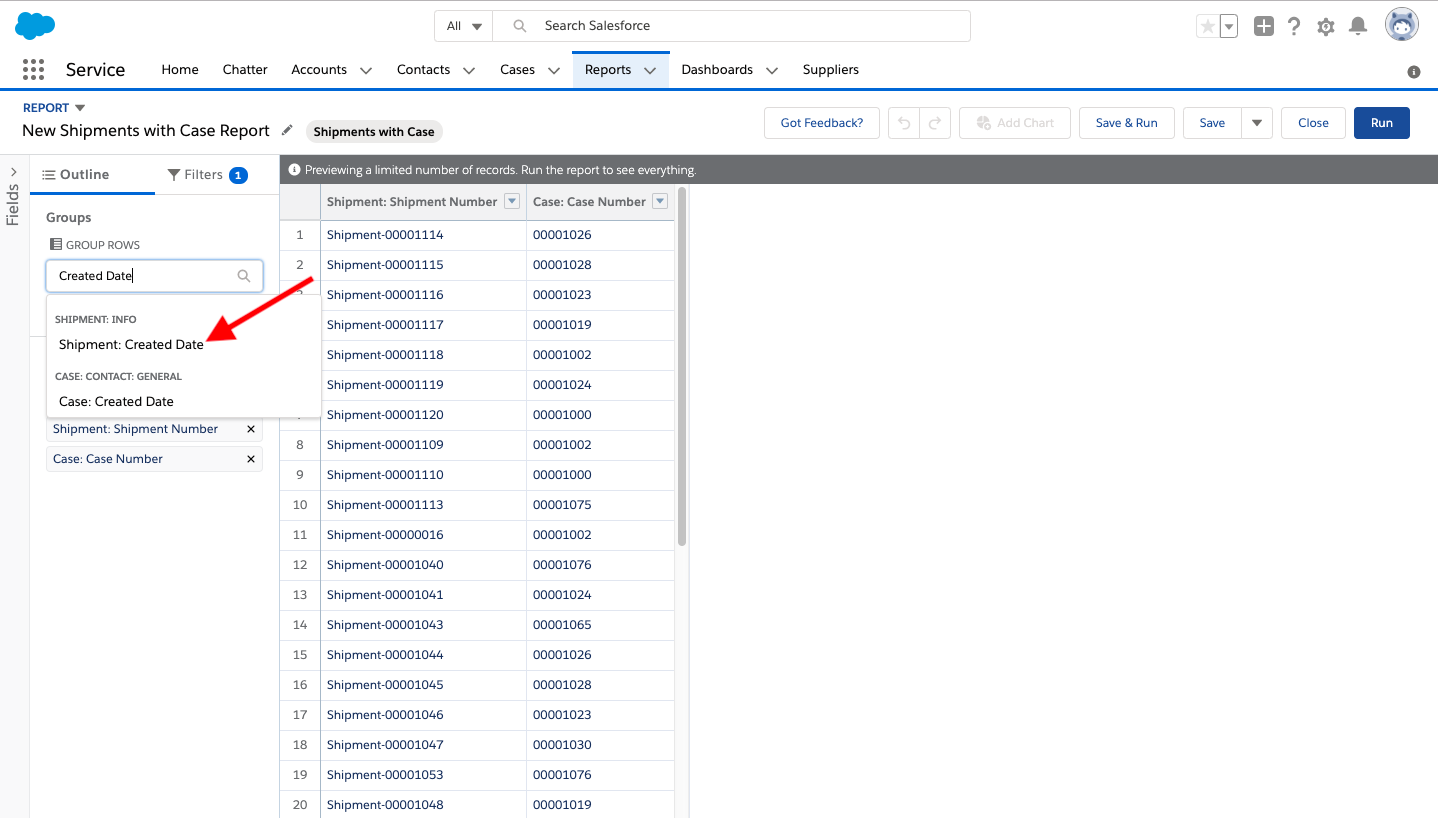
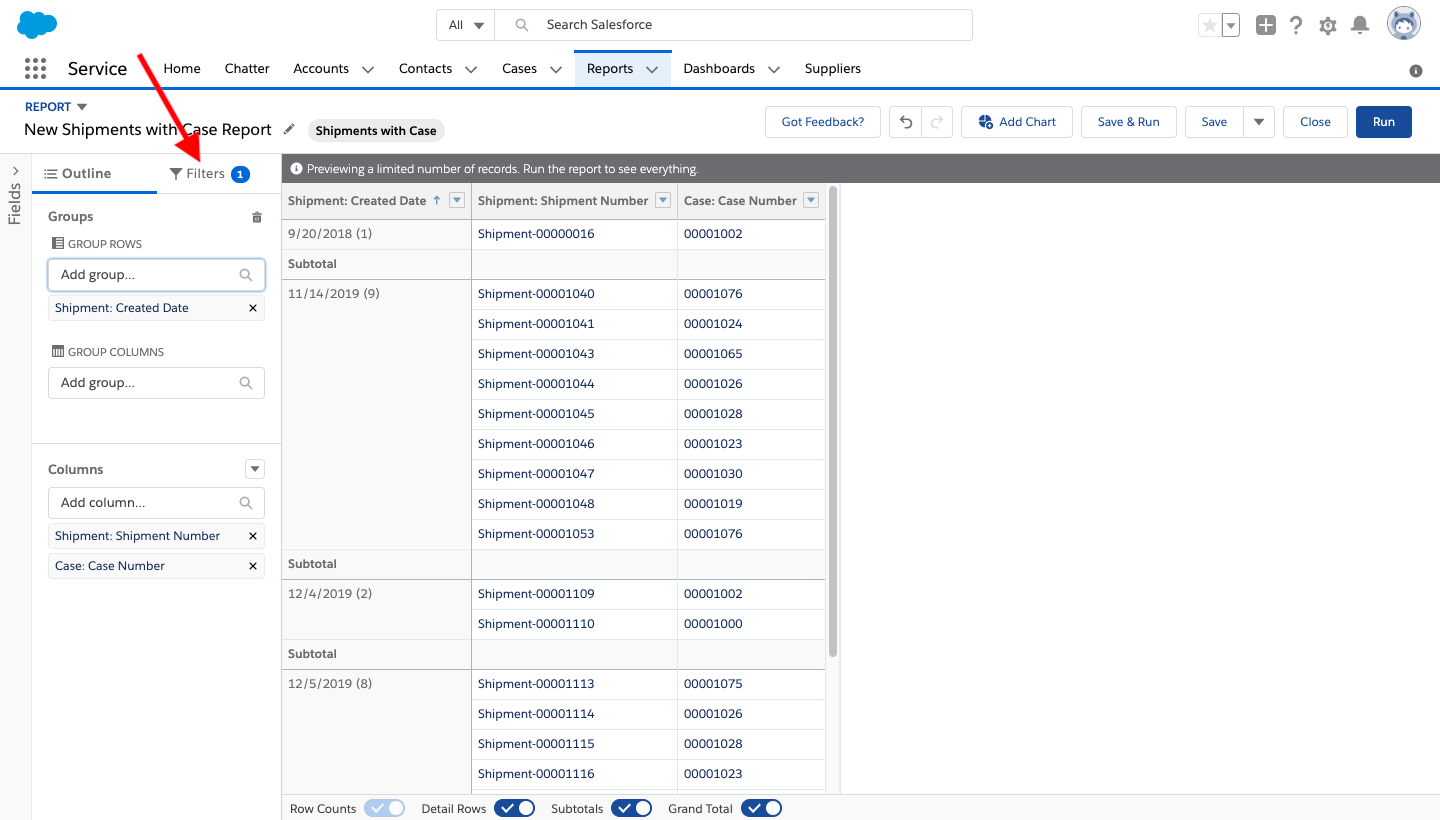
Group the report by Shipment Created Date.
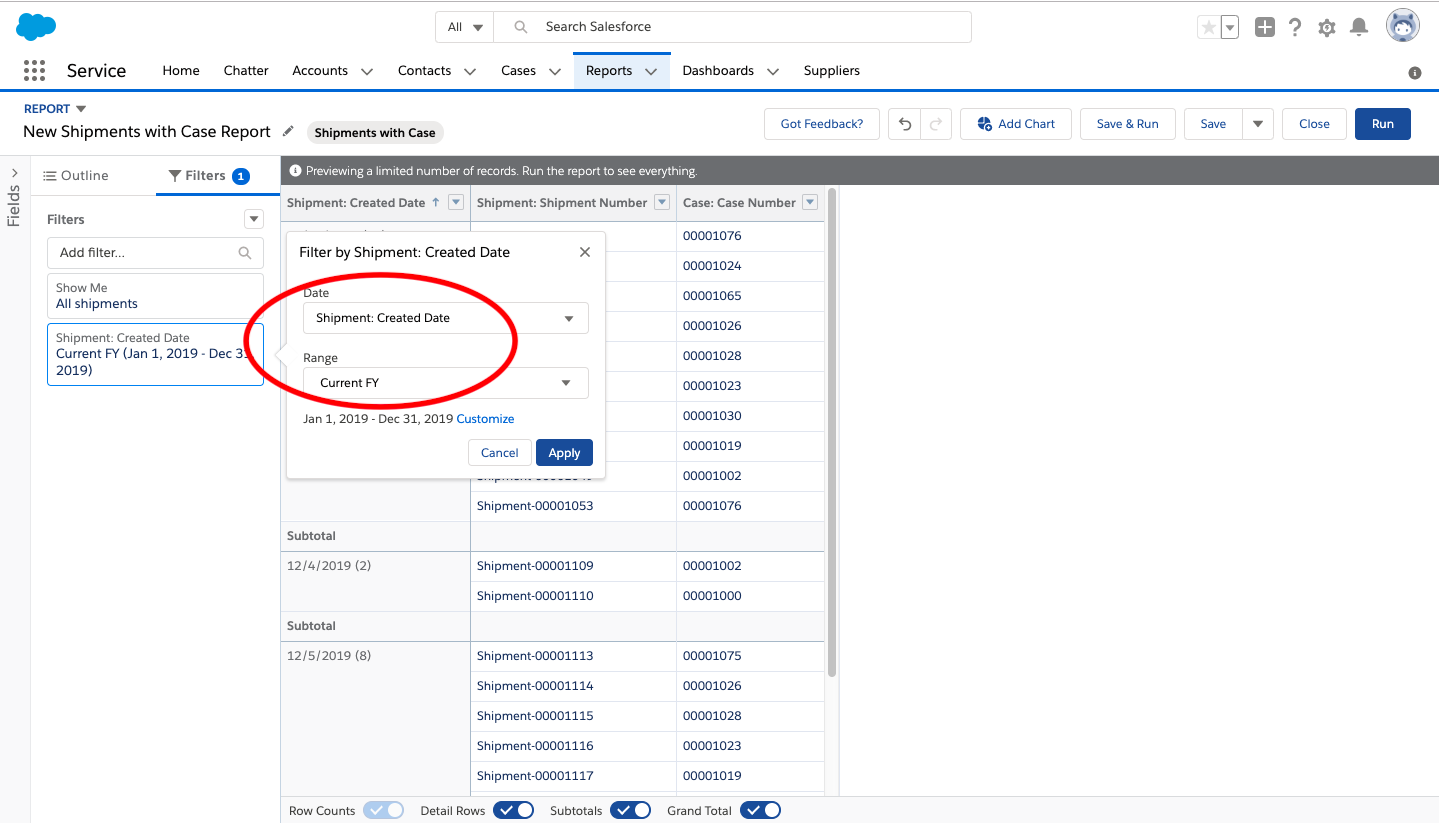
Then click on filters.
Select All Shipments, Shipment: Created Date, & Current FY.
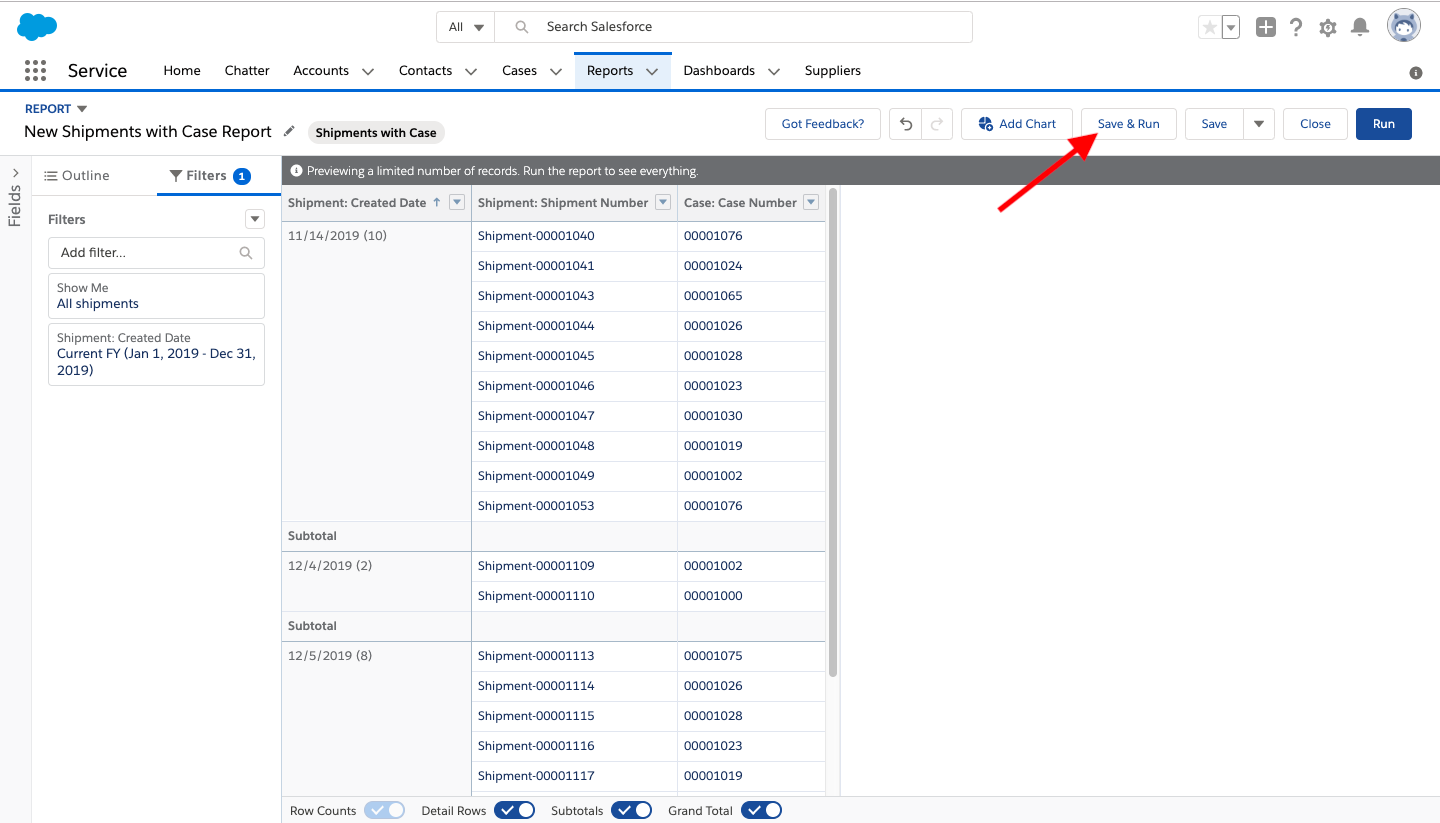
Now you are ready to run your report, click Save & Run.
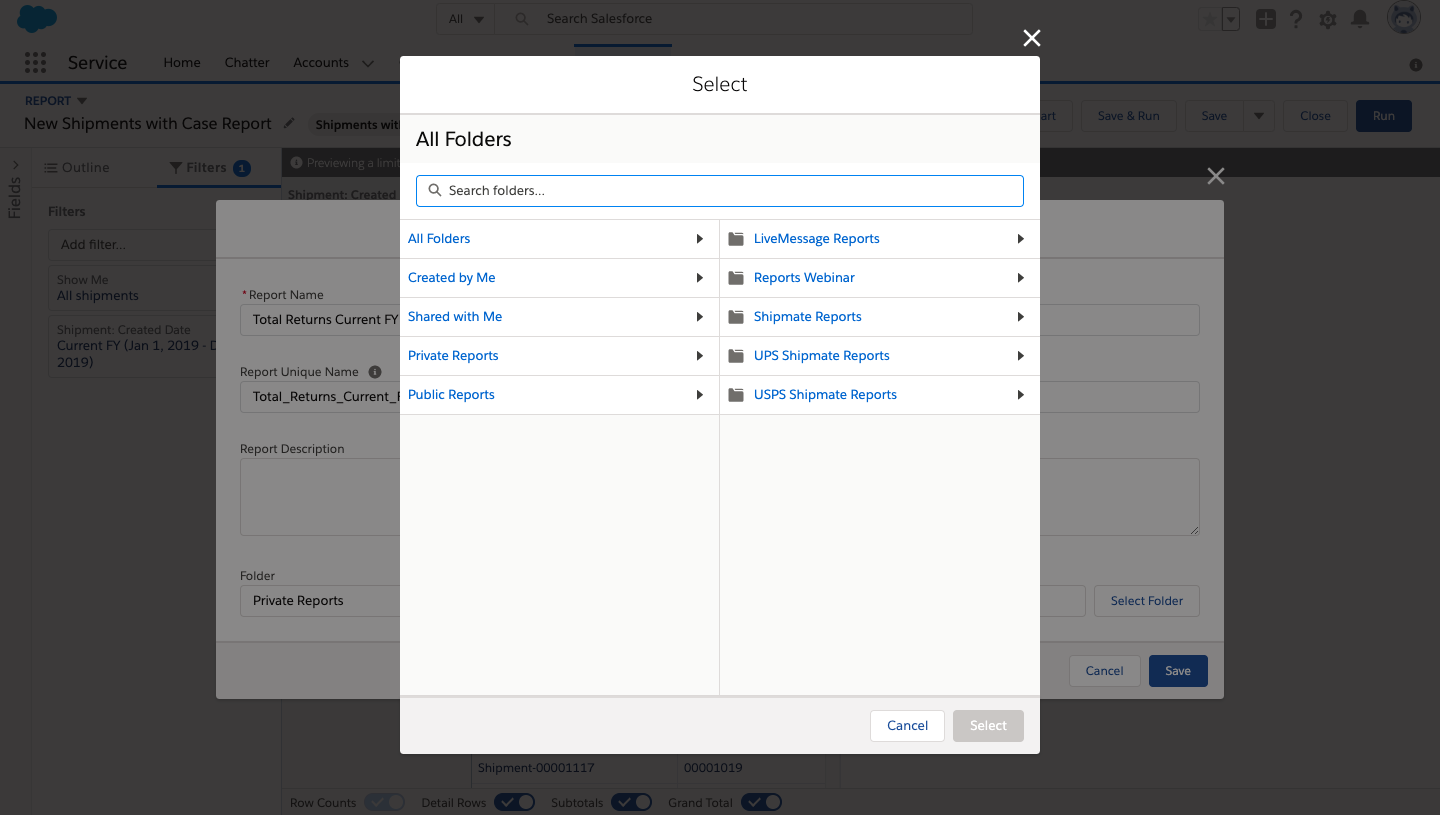
The next screen will allow you to name, describe, and manage report visibility.
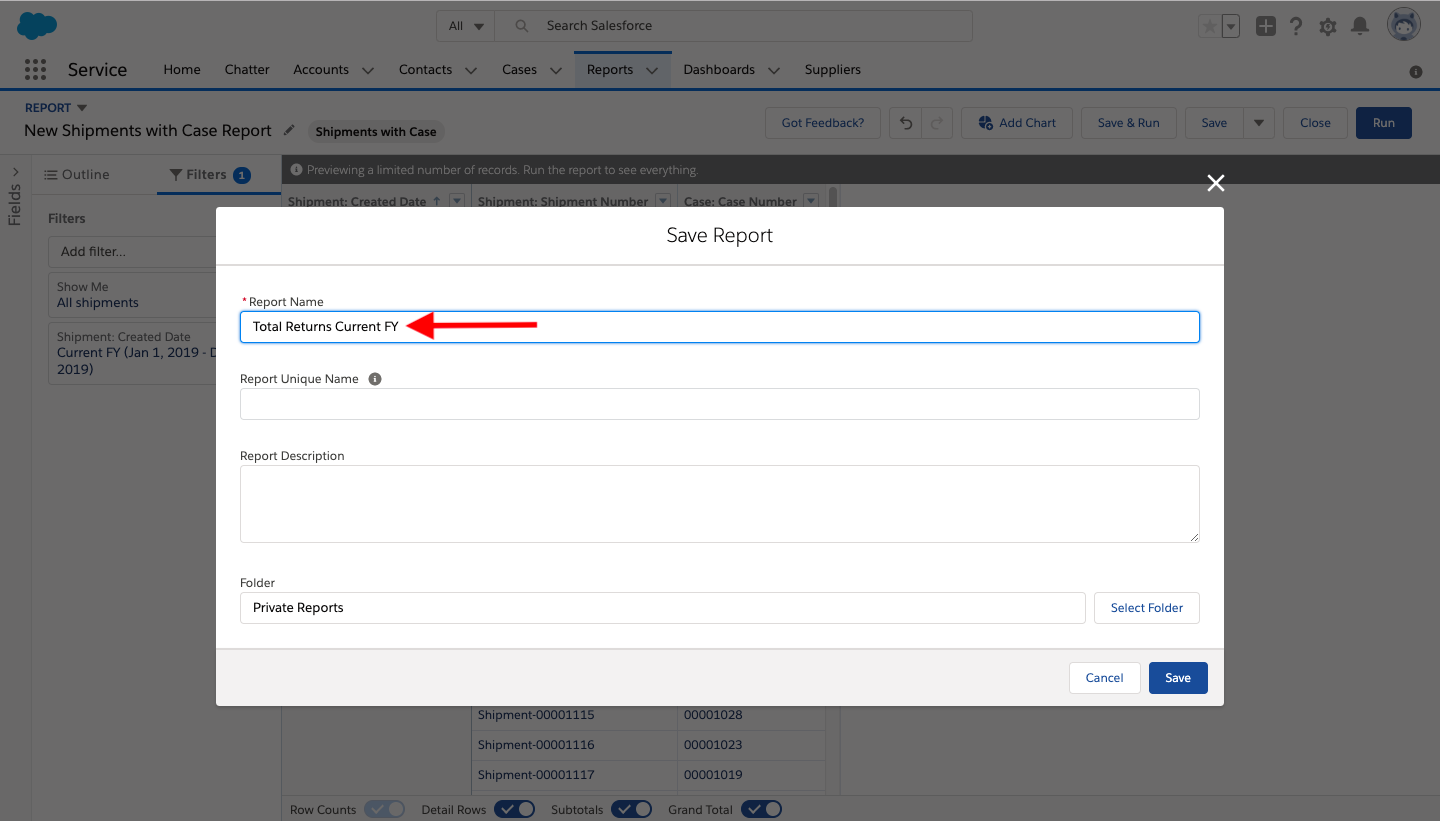
Clicking select folder allows you to choose the visibility of your report.
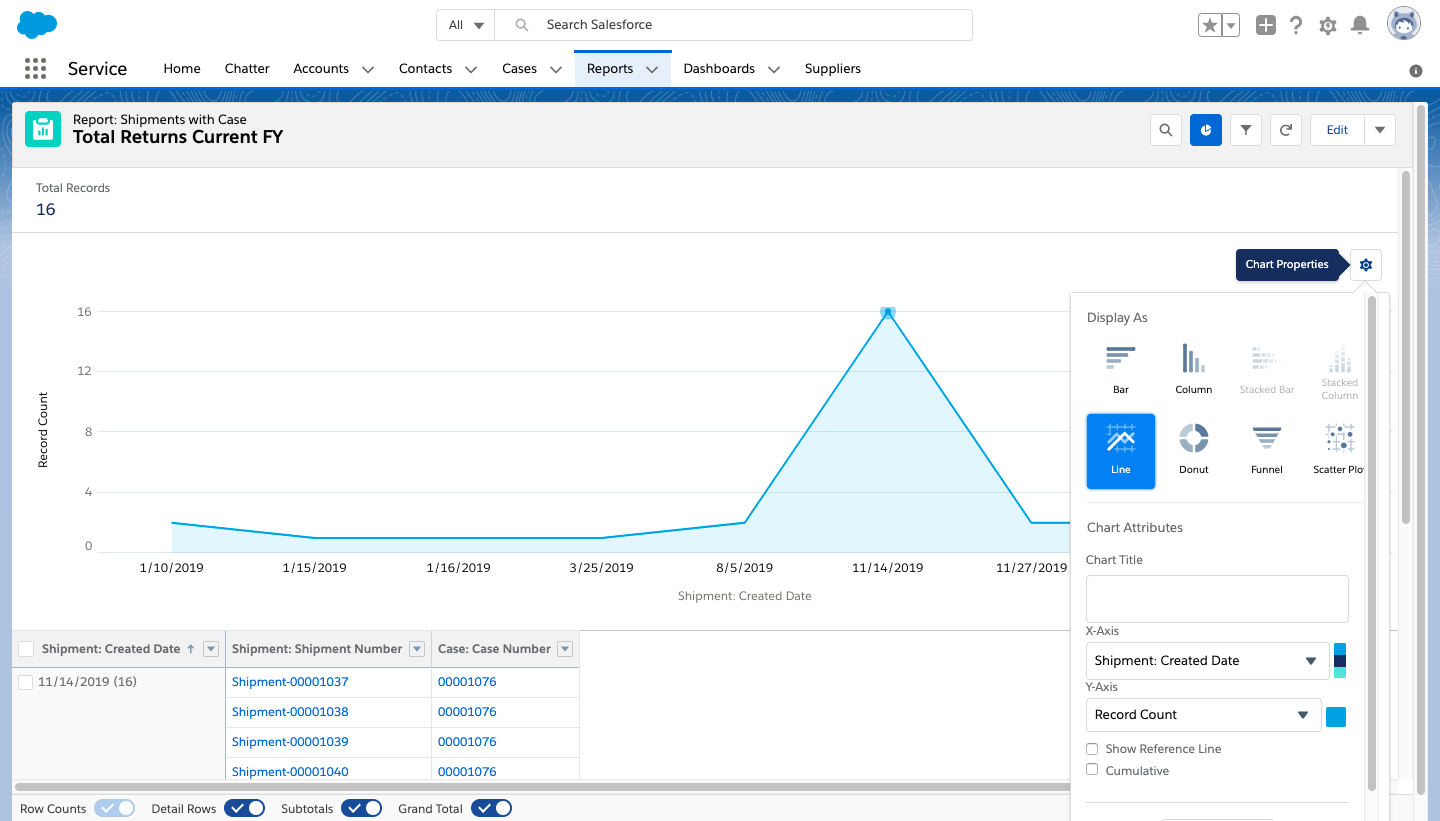
You will be able to toggle a chart in the navigation bar. For the Annual Returns Report, I chose a line graph to identify return trends over time.
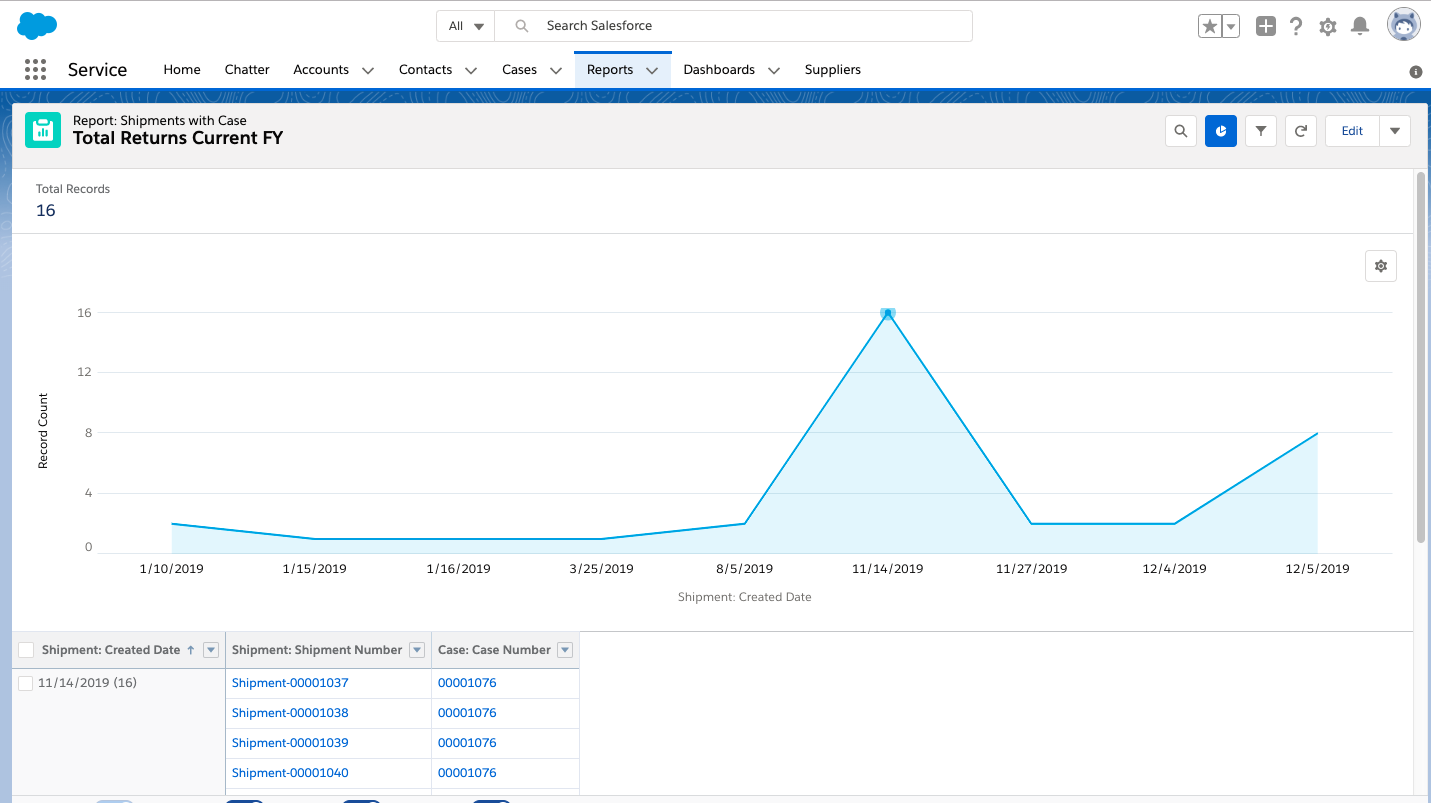
If you'd like to choose a different chart type click the chart properties cog above the chart.If you'd like to choose a different chart type, click the chart properties cog above the chart.